Costs (31.1)
- Thiago Casarin Lucenti
- Feb 11
- 4 min read

Chapter 31, Costs
Lesson Objective: To understand the importance of cost data and the break-even analysis
Costs are of vital importance to businesses in general. It is one of the elements that dictates the amount of profit a business will ultimately make. On regards of costs it is important for us to understand a few main topics:
The major uses of cost data;
The different classifications of costs of production;
Break-even analysis.
Simply put, cost data is key for business' success:
Costs are important for businesses to calculate profits:
- Keeping track of profitability overtime allows for comparisons against objectives as well as against other years/months.
Costs are important for pricing decisions;
Costs assist on budgeting decisions: how much money can a business spend on additional activities given the costs that have already been set?
Costs provide information regarding resources-efficiency: should a business employ labor or capital-intensive production methods?
Costs enable for various comparisons and decisions: location, production methods, etc.
When it comes to production specifically, costs are categorized differently:

While direct costs can be clearly identified at each unit of production (allocated), indirect (overheads) costs cannot be clearly and directly allocated.
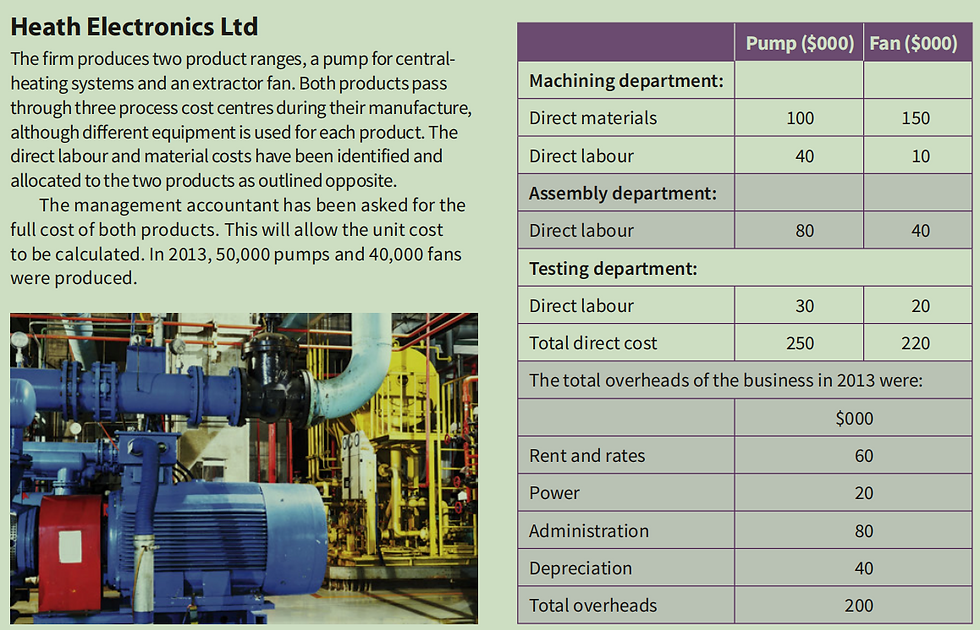
Example:

Production costs can also be classified between fixed, variable, and total costs - information we use to build a break-even analysis:

Fixed Costs: remain the same regardless of the level of output (e.g. making/selling 10 units or 10,000 units: fixed cost is the same);
Variable Costs: goes up and down according to the level of output: the more you make/sell, the more variable costs you will incur;
Total Costs: the sum of variable + fixed costs.
Activity 31.1
Important Notes:
Higher output translates into lower fixed unit cost as well as lower total cost per unit;
Marginal cost is the change in total cost that comes from producing one additional unit. It's important because it helps businesses determine the optimal production volume [EoS].

Going to back to the break-even analysis, the financial tool which helps determining the level of output needed for the business to break-even and start turning a profit:
How many customers do I need to cover my costs?

The BEP is the level of output in which total costs = total revenues;
At the BEP the business is not turning a loss nor a profit;
Building your own break-even analysis:
Method 1 - Graphical Method:

Information Needed:
Total Fixed Costs
Total Costs or Variable Costs
Sales Revenue (Output*Price)
Basic bits of the break-even graph:

Fixed Cost is always represented by a straight horizontal line along the x axis;
Sales Revenue line always starts at 0;
Variable Cost line starts at 0;
Total Cost line starts where the fixed cost line starts and increases as a proportion of the variable costs;
The BEP is where the total cost line meets the revenue line;
Anything below BEP is considered a loss;
Anything above BEP is considered a profit.

Margin of safety is the amount that sales can fall before the firm makes losses (e.g. if BE point is 400 and current production level is 600, the margin of safety is 200 units, or, 50%.
Method 2 - Equation Method:

Example:
- T Fixed Cost = $200,000
- Sale Price/Unit = $60,00
- Variable Cost/Unit = $10,00
Contribution Margin/Unit = 60 - 10
Contribution Margin/Unit = $50

Break-Even Level =
$200,000 / $50,00 = 4000 Units
This company needs to produce at least 4000 units to break-even.
The BE calculation can be used to determine a target profit level and therefore establish the level of output required in order to achieve the target profit (back to the example):
- Fixed Costs are $200,000
- Contribution Margin/Unit = $50,00
- The management of the business decides that their profit-target is $25,000 and so therefore the same formula applies:

New Break-Even Level for Desirable Profit:
$225,000 / $50 = 4500 Units
This business will need to make and sell 4500 units to reach its profit-target of $25,000.
Other important uses of the break-even analysis:

1. To evaluate price changes (marketing):
The graph shows the impact of a price increase on the sales revenue.
In this case the sales revenue increased from SR1 to SR2.
This example assumes that the level of output will remain the same despite the price increase (unlikely).

2. To assess operation decisions such as the purchase of new/more efficient equipment:
On the graph's example:
A new equipment will increase fixed costs but lower variable costs. Total costs would decrease in this case causing the BEP to be lower.
Benefits of break-even analysis:
Easy to construct and calculate;
Useful guideline to managers on profit/loss at different output levels and margin of safety;
Comparisons can be made as circumstances change;
Precise results are reached through the equation;
Location decisions, capital investments and other decisions can be reached.
Limitations of break-even analysis:
Assumes that revenues and costs are a straight line, which is not true;
Not all costs fall directly into variable and fixed costs (semi-variable costs exist but make the approach too complicated);
Inventories are ignored (assumes that every unit produced is sold);
New businesses can only perform forecast break-even analysis due to lack of data;
The analysis needs to be constantly updated to be relevant (as cost and price changes will impact the BEP).
To-Do List:
Activity 31.9
Activity 31.10
Activity 31.11
Chapter 31, Costs


Comments