Understanding Critical Path / Network Analysis (28.3)
- Thiago Casarin Lucenti
- Oct 29, 2025
- 6 min read
Chapter 28 - Operations Strategy
Learning Objective: Operations Planning and Critical Path
Major strategic Operations decisions involve major projects:
Relocation;
Factory expansion;
Change in production/operations methods;
Setting up a new IT system;
Installing new machinery.
One of the most costly elements of a major project like these has to do with unused or under-used resources (e.g. stocks, idling machinery or labor).

Such wastes happen due to different tasks being performed at different times without coordination of time and resources needed.
Companies want to minimize waste time and keep assets always active - a difficult task in very complex projects.
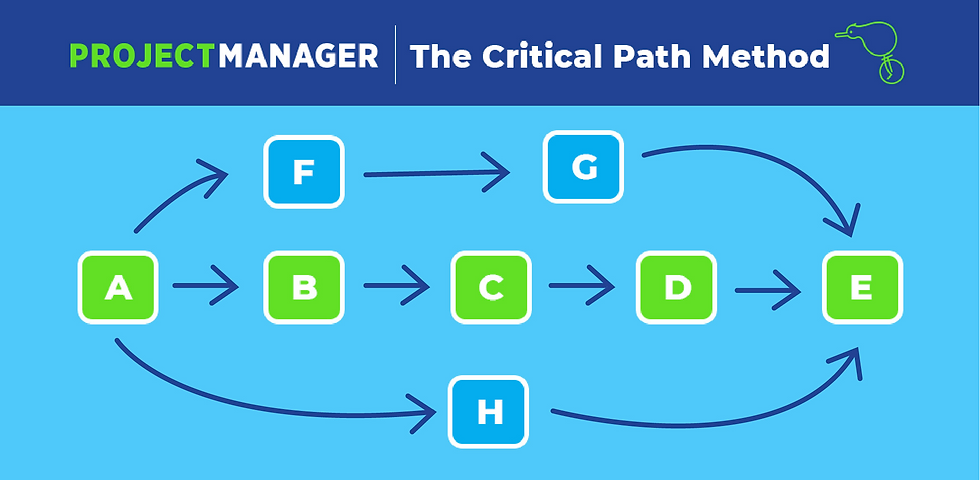
This is where the use of Critical Path Analysis comes in handy: it solves discrepancies by identifying all of the tasks in a project and putting them in a sequence which makes the most efficient use of time and resources:
As you can see, the process of creating a Critical Path Analysis depends on:

Identifying the objective of the project;
Placing the tasks which make up the project to the right sequence;
Plotting the duration of each task by the task itself;
Identifying the Critical Path by finding the key activities that must be finished on time for the project to be finished in the shortest possible time;
Using the resulting network as a control tool for mitigating problems.
Network Diagram (Figure 27.1) helps identifying the critical path by showing the logical sequence and dependencies of tasks:

- Note that, on the first node, two independent activities can start simultaneously and do not need to be performed in sequence.
Now that we have the tasks into place, let's look at the network of the critical path with the estimated time (duration) of each activity.

Quick overview on the Critical Path Construction:
Arrows indicate each activity;
Each activity takes up time and resources;
Each node indicates the end/start of an activity;
The arrows with two parallel lines shows the critical path (more on this soon);
If any activity gets delayed, the entire project also gets delayed.
How do you determine the critical path?
The critical path is the sequence of activities that, if they ever get delayed, then the whole project will take longer than anticipated.
In this case, the critical path is made out of the activities A, C, E, F, H and the 3 weeks duration.
Let's work out a Critical Path Analysis activity:
The objective is to construct a house in 42 days. To create the network diagram, the tasks to be performed in order to build the house have been broken down into ten main activities, such as digging foundations and tiling the roof. These activities must be done in a certain order – the roof cannot be tiled before the walls are built, for instance. The network diagram for these activities is shown in below:
We should have the information about the dependence between activities as well as the duration of each activity to continue with the diagram:
Activity | Preceding Activities | Activity Duration (days) |
A | - | 8 |
B | - | 6 |
C | A | 12 |
D | B and C | 6 |
E | A | 14 |
F | E | 10 |
G | F and D | 3 |
H | B and C | 14 |
I | G and H | 3 |
J | I | 4 |
Based on the preceding activities we can put the diagram together:

Now we can add the duration times for each activity to calculate the critical path as well as the spare time (a.k.a. float time) for non-critical activities:

The critical path is indicated by calculating, at each node, the earliest start time (EST) and the latest finish time (LFT).
The EST of an activity is the earliest an activity can start taking into account all the preceding activities. For example:
Activity E cannot start before day 8 because Activity A won't be finished before then;
Activity D cannot start before day 20 because Activities A and C have to be completed first.
To calculate the EST you work from left to right by adding the EST of the previous activity to its duration, example:
- Obviously, the EST for A is 0 and A lasts 8 days - therefore, EST for activity E will be 0+8 = 8 days;
- The EST for E is 8 and the duration of E is 14. The EST for F will be 0+8+14 = 22;
- The EST for D is calculated by looking at activity C EST + its duration - although it depends on activity B, activity D cannot start any sooner because activity C cannot be completed before day 20.

To calculate the LFT (bottom of the node) you work your way from right to left and subtract the duration of the activities:
Activity J lasts 4 days and so the LFT in node 7 will be 42 - 4 = 38;
Activity I lasts 3 days and so the LFT in node 6 will be 38 - 3 = 35;

Attention: where there is a choice of routes back to node, the aim is to achieve the lowest number for LFT:
For Node 4, subtracting J, I and H gives a lower result than the route J, I, G, and D.
Now that we understand EST and LFT, let's dive in to Float Times using the same previous diagram.
Activities B, C, D, and H are not on the critical path and therefore are considered non-essential activities;
These activities have spare time (so called float).
There are two types of float:
Total Float, which is the amount of time an activity can be delayed without delaying the whole project duration;
Free Float, which is the amount of time an activity can be delayed without delaying the start of the following activities.
Let's calculate Float Time considering the diagram:

Total Float Formula:
Total Float = LFT - Duration - EST
Calculating for activity D where LFT is 32, duration is 6, and EST is 20
Total Float (D) = 32 - 6 - 20 = 6. The activity can be delayed up to 6 days without extending the total project duration or impacting on the critical path.
Free Float Formula:
Free Float = EST (of the next activity) - Duration - EST of the activity in question
Calculating for activity B where EST of the next activity (D) is 6, duration of B is 6, and EST at the start of B is 0:
Free Float (B) = 20 - 6 - 0 = 14. Activity B could be delayed by 14 days without delaying the start of the next activities (H or D).
Important: the critical path is determined by activities with no spare time (where EST and LFT are equal).

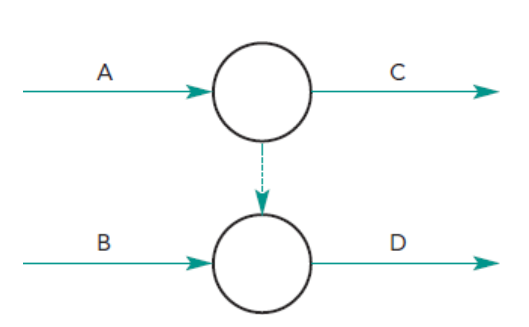
Dummy Activities are not actual activities since they don't consume resources and time. They are dotted lines showing logical dependency between activities.
Let's look at a new example:
- Activities A and B are the start of the project. They have no preceding activities.
- Activity C follows A.
- Activity D follows A and B
Based on this previous information, is this diagram correct? Why?

It is incorrect because it assumes that activities C and D require both, activities A and B to start - which is not true! Activity C does not require both (A and B) to start. The correct diagram, therefore, would be:

- This diagram shows that activity C requires activity A only (and not A and B);
- However, it also shows that activity D requires both, A and B to start.
- The dummy activity (the dotted line) shows the relationship between A and D, with the arrow indicating the direction of the dependency.
Activity 28.8
To wrap it up: what are the advantages of CPA (network analysis)?
It allows the business to give accurate delivery dates for its projects;
EST allows for the correct equipment and supplies to be scheduled at the right time (JIT);
LFT allows for visualization of whether the project is up to schedule;
It allows for quick actions to be taken in case of delays on activities with no float;
It helps identifying which activities need to be speed up in case one activity gets delayed;
Allows for efficient use of resources (resources can be directed to critical activities from non-critical ones so that the critical ones can be speed up);
It shows the tasks that can be tackled simultaneously shortening the project time - it gives the business competitive advantage on developing new products quicker;
Launching a new product quickly in a competitive environment makes a difference - network analysis enables teams to identify and undertake activities simultaneously reducing the total time of the project (simultaneous engineering).
Evaluation of the Network Analysis:
It is a technique to assist project management and does not guarantee a successful project (depends on other factors such as finance, workers, and external);
Poor management skills will still lead to unsuccess managing the project;
Workers need to be consulted about the project duration or else motivation will decrease (pressure);
When performing a project for the first time estimating the duration will involve guesswork, making it less accurate.
Chapter 28 - Operations Strategy
To-Do-List: Activity 28.9


Comments